
The Definitive Guide to Improving Site Speed

Web site speed determines whether customers can find your brand, trust your store, and ultimately buy from you. No matter what you prioritize in 2021—whether it’s sales growth, customer retention, or scaling internationally — it all hinges on how your site performs. This definiteive guide will provide you with the answers you're looking to speed up your website.
Why website speed matters
The deadline to speed up is here. Google will update its search rankings to prioritize page experience signals in May 2021, penalizing brands with slower sites. The consequences of poor-performing sites—like lower conversions and lost sales—will now include a drop in organic search rankings.
But the more successful your brand is, the harder it is to improve or maintain site
performance. Unless you’re vigilant about site speed, small problems can easily go
unnoticed, accumulate over time, and result in bloated sites that bleed sales.
Let the data guide you: Link site performance to financial performance. Test the impact
a 1-second change in load time has on revenue.
The site speed killers we identify, as well as the fixes, are grouped in sections related to
the customer journey: discovery, browsing, and conversion. Though a particular site speed problem can have an outsized impact on its category, the impact isn’t limited to that group.
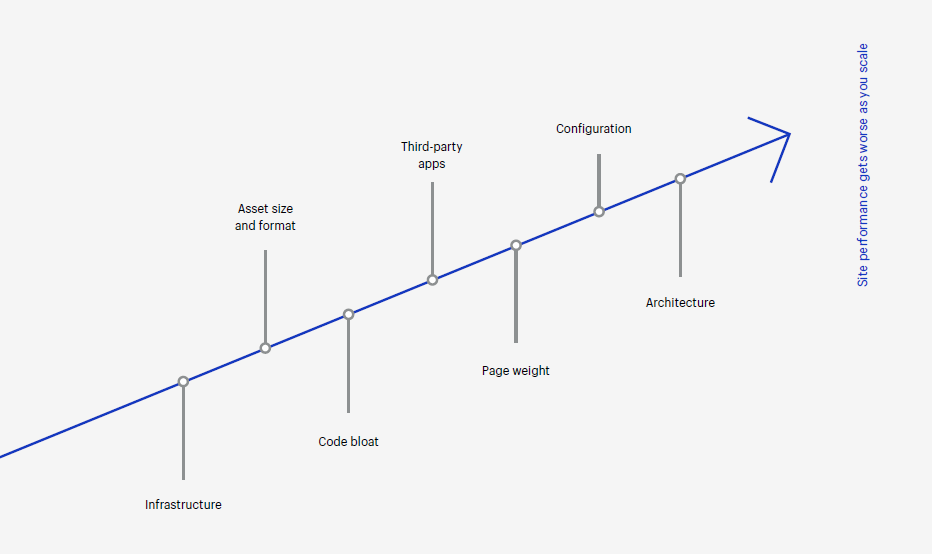
Site performance gets worse as you scale
The more success you have in ecommerce, the harder it is to maintain optimal site
performance. Code, apps, and scripts accumulate. Customizations, new features,
and infrastructure decisions that once worked now become roadblocks.
This is a problem that grows with complexity. As brands grow and become more sophisticated, their websites become richer. This richness usually comes with a price; unless you are actively paying attention to speed, changes will slow down your site.
- Javier Moreno
Data Science Manager, Shopify
You’ll likely outgrow your infrastructure as you scale. What worked with a hundred
staff members and a hundred thousand monthly site visitors falls apart when you
experience 10X growth. For example, brands hosting flash sales need a holistic platform,
including hosted storefront, checkout, and payment methods that scale on demand to
accommodate mega traffic spikes. Here we outline some of the performance killers—
and their fixes—on your journey to scale.
Each issue has a tangible impact on the customer journey, from discovery to browsing
to conversion.
Performance issues scale as you grow
The impact of speed on discovery
Eighty-two percent of websites analyzed are plagued by issues that significantly affect
performance, and 44% have critical issues. The deadline to fix these issues is approaching quickly. Google announced they would begin scoring sites in May 2021 based on Core Web Vitals like speed, among other factors, to rank and recommend sites.
Sluggish performance will negatively impact organic search rankings.
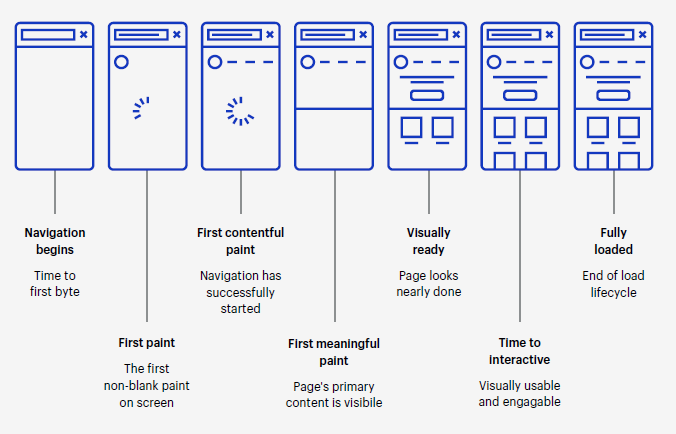
Calculated by Core Web Vitals, your score will be a number out of 100 and will measure a variety of performance metrics to determine how fast your website feels to real visitors. You can also use Google Lighthouse: Instead of using data from real users, it measures your website in a simulated lab setting to get a sense of how your site performs and to track your progress as you work to speed up. Here are the grading metrics:
"How a page loads"
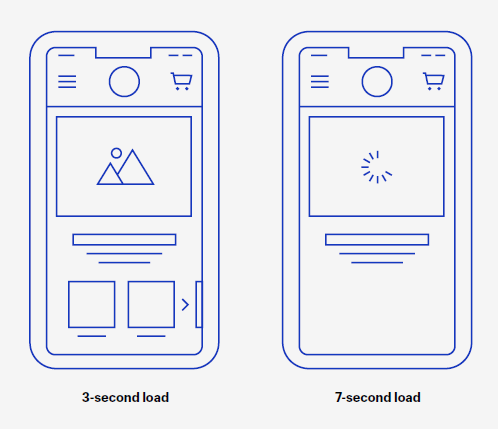
According to an annual report card by Retail Systems Research, brands just outside the
uppermost tiers of the Internet Retailer 500 have improved mobile page load time scores from 9.25 to 7 seconds, but it’s still a far cry from the 3-second mark that shoppers expect. Your site will be measured in milliseconds, and relatively minor speed oversights can significantly impact how high you rank.
Page loading time
Performance issues related to discoverability
The code and third-party apps you add to your site weigh down your pages, slow load
time, and will soon result in search engine optimization (SEO) penalties. Even brands with relatively sophisticated development teams can unknowingly harm site performance by trying to improve the site speed and the customer experience.
Code bload issues
- Brands often prioritize images (both quality and quantity) to improve site speed, when in fact there are higher impact ways to optimize while still creating room for highquality images and media. One large offender is with JavaScript issues, whose execution accounts for 40% of the Lighthouse score. And as features pile up, so does the amount of JavaScript on your page. JavaScript takes additional time to download, parse, and then execute. The more JavaScript accumulates, the more your site slows downs.
- Poor-performing sites can also be using parser-blocking JavaScript (using <script>
instead using <script async> or <script defer>). These are often tags added by stack overflow snippets, poorly designed apps, or sites that depend on jQuery in inline JavaScript parts of a theme.
How PrivateAnalytix can help
PrivateAnalytix uses a JavaScript pixel that only weighs <1KB, which is ~60x smaller than Google Analytics. It is also significantly smaller than many other larger analytics providers.
Improved website loading speed
Web analytics like any other website element add an additioanl weight to your pages, as well as extra loading time to your website. Please see a short comparison between PrivateAnalytix and a several other highly utilized analytics providers:
Google Tag Manager
https://www.googletagmanager.com/gtag/js 28 KB
Google Analytics
https://www.google-analytics.com/analytics.js 17.7 KB
Matomo
https://example.org/matomo.js 22.8 KB
PrivateAnalytix
https://privateanalytix.com/js/script.js <1 KB
PrivateAnalytix is built to be very lightweight, to have a zero to negligible impact on your website loading speed, and to reduce your site's carbon footprint.
Does Google Analytics slow down my website?
Google Analytics is the most widely used website analytics prvider on the market. In fact, it is utilized on more than 50% of all websites on the internet. The way Google Analytics perates is by installing the Global Site Tag (gtag.js) tracking code across your web site.
Below is the Google Analytics tracking script that needs to be added to your website:
<!-- Global site tag (gtag.js) - Google Analytics -->
<script async
src="https://www.googletagmanager.com/gtag/js?id=UA-XXXXXXX-XX">
</script>
<script>
window.dataLayer = window.dataLayer || [];
function gtag(){dataLayer.push(arguments);}
gtag('js', new Date());

gtag('config', 'UA-XXXXXXX-XX');
</script>
The size of https://www.googletagmanager.com/gtag/js is 28 KB. In addition to the googletagmanager, the script downloads an additional JavaScript file called the Google Analytics tag (https://www.google-analytics.com/analytics.js). It adds extra 17.7 KB to every one of your web pages.
The two tracking scrips combined add up to 45.7 KB each time your web site's web pages are loaded.
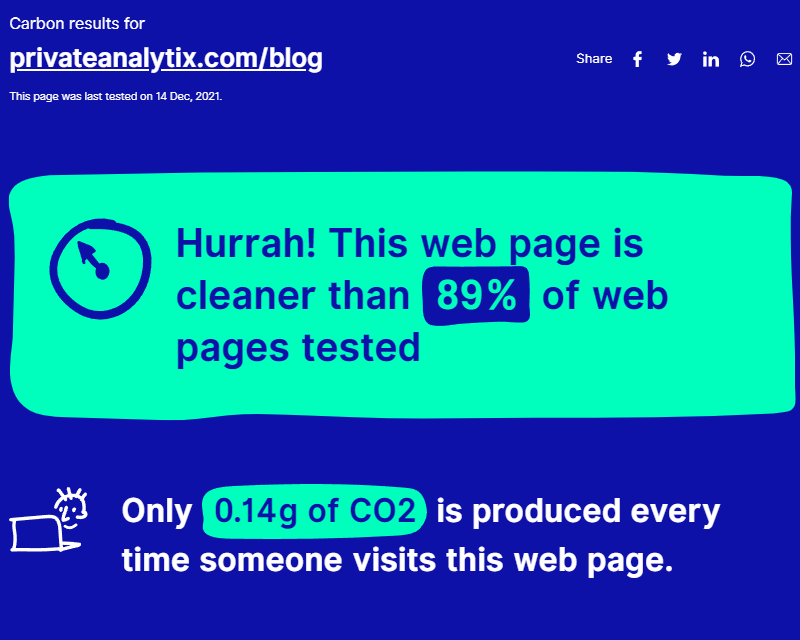
Reduced electricity requirements
Try to estimate your website's electricity requirements ising the Website Carbon Calculator. It will give you an approximation of how many grams of CO2 are produced by each one of your visitors.
Improved traffic analytics accuracy
Google Analytics is used on ~50% of web sites on the web. Browsers like Firefox and Brave already have a built-in function to block Ads and tracking. This significantly reduces the accuracy of the analytics reporting that Google Analytics provides.
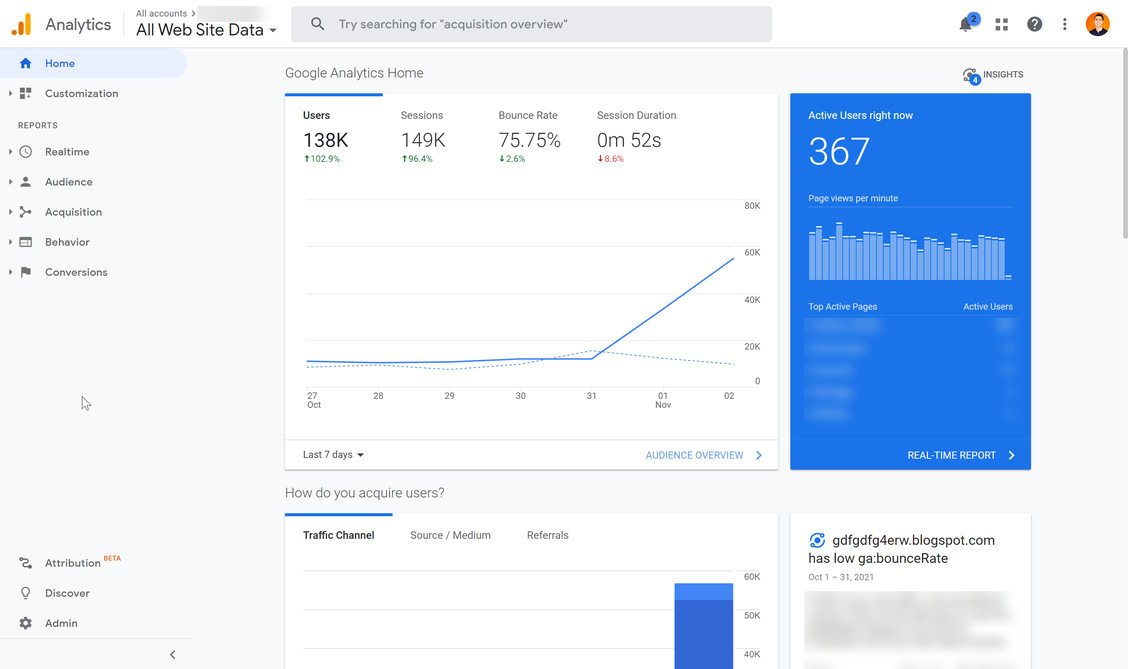
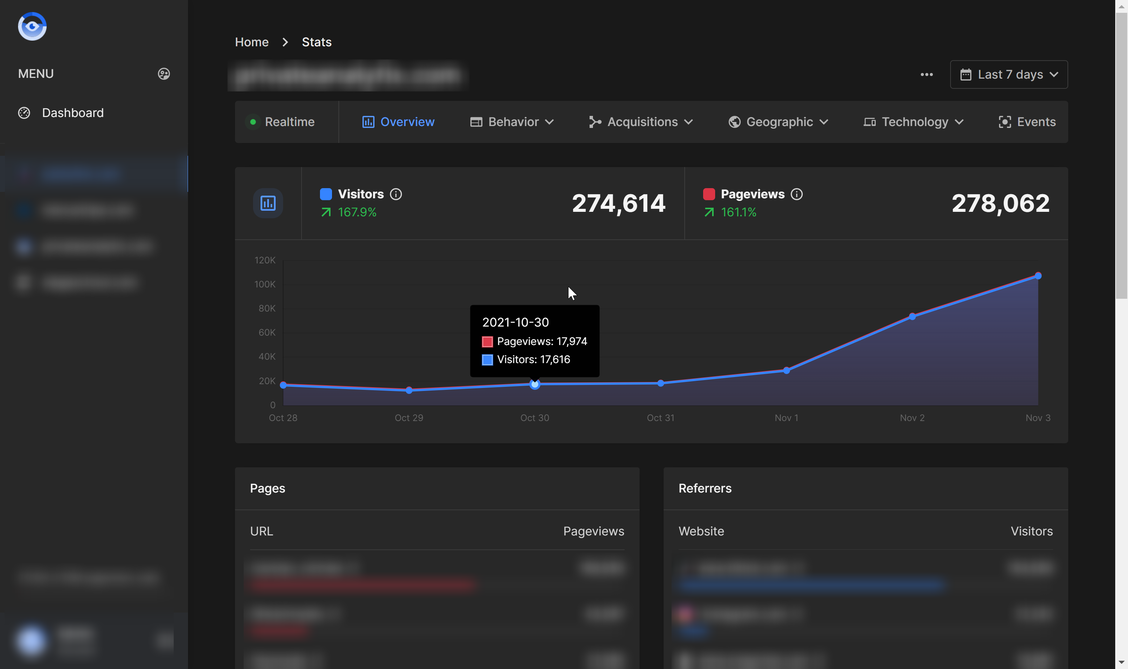
In our recent case study, we found that the analytics reporting discrepancy for the same web site over the same tracking period can be as high as 50%.
Google Analytics traffic report
PrivateAnalytix traffic report
Other factors that impact website loading speed
Third-party integrations
- Third-party solutions can slow down your site with synchronous scripts, stylesheets, or fonts loaded from third parties within your <head> tag. Parser-blocking scripts added directly into the <head> often have an immediate impact on performance.
- Even integrations (e.g. apps) you’ve uninstalled can leave behind snippets of code that bog down your site, making you less discoverable as a result.
- A/B testing tools like Google Optimize can cause pages to go blank between transitions by using an anti-flicker snippet, which hides the initial page until the experiment container is ready. In fact, Google Optimize can even slow down your site when you aren’t running experiments at all.
Page weight issues
- Pages come in all shapes and sizes. As certain pages become heavier over time, they can load at varying speeds in different geographic locations or on different devices, negatively impacting international expansion efforts. You can see a list of oversized or unused files in your Lighthouse audit recommendations.
- Heavier pages load more slowly and might not immediately render what’s above the fold, a page’s most valuable real estate.
How to improve website speed and discoverability
Keep your site lean and nimble
Use minification to shrink the code you need. Remove poorly coded HTML, CSS,
and JavaScript on your site to reduce the amount of data you send to users without
impacting functionality.
Conduct a forensic audit of your third-party integrations
Take a look at your existing integrations (e.g. apps) and quantify the value they add
to your business. Some apps power product recommendations and social image
feeds that unnecessarily request massive images. Compare the value with possible
performance reductions, and remove unnecessary or value-destroying integrations.
Even after you’ve uninstalled an app, search your site for traces of leftover code and
manually remove it to be sure it won’t impact performance long after it’s gone.
To guide your app cleanup efforts, create speed benchmarks to confirm whether
the work you’re doing improves performance at all.
Prioritize loading above the fold
Instead of forcing users to download every image on your site, lazy loading only initially
shows shoppers images at the top part of your site. Only after users begin scrolling
down will the page fetch the images for that section of the page. Lazy load your site with JavaScript libraries like lazysizes, lazyload, and yall.js. If most of your visitors use Chrome, lazy load selected images by adding the loading=“lazy” property to the <img> tag, though be aware that your images won’t lazy load in other browsers.
Calculate the trade-off between speed and page weight
Record page weight as well as load time when benchmarking site performance. Use these inputs to direct your optimization efforts. For example, say your average page weighs 15 MB and loads in 2 seconds. If you want to reduce load time by 0.7 seconds—and your infrastructure is able to deliver on average 7.5 MB to the user—you need a page weight of no more than 9.75 MB per page to meet your 1.3-second load goal.
Case study: Emazing Group
The Emazing Group, the parent company of a trio of leading lifestyle brands, worked
with their internal tech team and outside agency partner to improve site performance.
Specifically, The Emazing Group improved its lazy loading times to ensure the tops of its
pages loaded instantly. Besides laying a foundation for a better Lighthouse score, The Emazing Group reports:
- Sites now load under 3 seconds, down from 4.5 seconds the previous year
- Conversions increased to 4.08% from 2.45% the previous year, with mobile
conversions up 4.13% from 2.45%
The biggest gain for us has been controlling loading priorities for different elements on each page. We would prioritize anything above the fold to give the illusion that the site is very fast.
Bran Lim
CEO and Founder, The Emazing Group
The impact of speed on browsing
Enriching the browsing experience is a necessity when you consider that just 10% of
shoppers visiting your site will add an item to their shopping cart. But the very tools,
information, and nudges that prompt shoppers to buy can significantly slow down your site:
- Bounce rates can go from 9% to 38% in the extra seconds it takes
a product page to load - 57% of shoppers have left a slow-loading site and purchased from a competitor
- Poor browsing experiences cost large brands up to $100,000 an hour in lost sales
Nearly a quarter of all customer journeys begin on a product detail page (PDP), which
is notoriously image and text heavy. PDPs usually contain code or third-party apps that:
- Use 3D product modeling or immersive augmented reality (AR) to bring
collections to life - Embed social feeds to highlight user-generated content for engagement
and authenticity - Showcase customer reviews to increase purchase decision confidence
- Nudge customers by instilling urgency with fear-of-missing-out promotions,
inventory counters, or countdown clocks
According to a study by Retail Systems Research in 2019, when asked to identify the two online features that make shopping online most enjoyable, product ratings or reviews and the ability to compare similar products topped the list.
Creating rich PDPs that are also fast often requires difficult trade-offs between performance and functionality. Optimizing your PDP’s Largest Contentful Paint, or the shopper’s perception that your PDP is useful, is vital to improving the browsing experience.
Performance issues related to browsing
Fast PDPs and landing pages are structured to balance speed with a feature-rich browsing experience. High-growth brands that routinely run user experience experiments must minimize the negative speed impact of third-party scripts and apps while architecting product pages optimally.
Configuration issues
- Third-party synchronous scripts, stylesheets, or external fonts loaded within your
<head> tag can negatively impact the browsing experience. Scripts added directly
into the <head> often have an immediate impact on performance. - Third-party scripts, domains, and resources—think Google Analytics, Tag Manager, or Facebook—are not always immediately discovered by browsers. They can cause TCP (transmission control protocol) and TLS (transport layer security) delays and compete for bandwidth. This particularly degrades mobile browsing experiences, which is critical in a time when mobile shopping is growing: 67% of sales were made on mobile devices versus 33% on desktop during Black Friday Cyber Monday in 2020.
- Unsupported external web fonts will not always render immediately, which can
cause load delays.
Architecture issues
- Reliance on an application layer running PHP or a server environment—and an SQL database that must be referenced—to compute data and return results before a site or page can render
- Faulty mobile design or architecture—one with too much data powered by a
server with limited memory—that might not render completely or quickly if making excessive HTTP requests, especially on older devices connected to cellular networks Infrastructure concentration that creates distance between distribution buckets and end users - Unreliable and unpredictable third-party integrations that add friction to the
customer journey, which increases bounce rate
How to improve performance and browsing
Shave hundreds of milliseconds with preconnects
Preconnect to key third-party domains to help browsers download faster. Google
engineers recommend rel=preload as a hint resource that allows early fetches of critical
resources before the browser would otherwise discover them. A domain name system
(DNS) prefetch rule will instruct the browser to look up and cache the DNS information for an external domain and potentially shave hundreds of milliseconds from load times.
Guarantee blazing-fast product page loads with web fonts\
Ensure well-crafted product descriptions on high-converting product pages render
fast by swapping external fonts that load immediately. Add a font-display:
swap property in your @font-face declaration, or, if you’re using Google Fonts,
a & display=swap URL parameter (e.g. <link href="https://fonts.googleapis.com/
css?family=Roboto&display=swap" rel=“stylesheet”>).
Conduct an audit of your third-party integrations
Take a look at your existing third-party integrations (e.g. apps) and try to remove as much “jankiness” as possible from the browsing experience. Jankiness is something that Google is trying to capture with Cumulative Layout Shift in Core Web Vitals. Consider the possible performance reductions of any integrations, and remove the ones that don’t add value.
Case study: Rebecca Minkoff

Rebecca Minkoff is a couture high-fashion brand that has leaned into retail technology
like smart mirrors, self-checkout, and radio-frequency identification chips in handbags.
The company has adopted 3D modeling and AR on its product pages, connecting shoppers to its catalog in newer and more effective ways than ever before. Shopify lazy loads 3D models to minimize the image’s impact on performance. Since implementing 3D and AR, Rebecca Minkoff has seen:
- Shoppers are 44% more likely to add an item to their cart after interacting with it in 3D
- Customers are 27% more likely to place an order after interacting with a product in 3D
- Visitors are 65% more likely to place an order after interacting with a product in AR
The impact of speed on checkouts and conversions
Slower sites negatively impact conversions. The widely cited statistic—a 1-second delay in page load time results in a 7% decline in conversions—understates the true impact since the pandemic’s acceleration of ecommerce by 10 years. A 1-second speed mprovement could mean up to a 27% increase in conversions. Even the smallest improvement—we’re talking milliseconds—can generate millions of dollars in additional sales.
Research suggests that improving mobile site speed by just 0.1 second can lift conversions by 8% and spending by 10%.
Consumer surveys reveal customer expectations are high:
- 79% of customers who are dissatisfied with a site are less likely to return
- 64% of smartphone users expect a website to load in 4 seconds or less
- 47% of online shoppers expect web pages to load in 2 seconds or less
Performance issues related to conversions
It’s not uncommon to outgrow the foundation on which you build your business. Likewise, brands often lack the technical expertise necessary to optimize infrastructure and marketing assets as they scale.
Infrastructure issues
- Self-hosted ecommerce sites that lack bandwidth are prone to crashes during
high-traffic times like holiday promotions and flash sales, or periods of rapid growth. - Inexpensive DNS hosting is often “free” with your registrar fee, but can lack the high availability and low latency necessary to scale and expand internationally.
- A single content delivery network (CDN) that is hosted in one geographic region can bog down your site for visitors in other regions or markets.
- Inflexible checkouts don’t benefit from cache loading, so it can take up to 20
seconds for a simple page to load, execute, and render hundreds of JavaScript and
API requests, resulting in a slow checkout.
Asset size and format issues
Conventional wisdom says high-resolution (hi-res) images are better—and they are,
in the right context. What’s problematic on a site or app is using a large image when
a smaller one would do.
Format matters, too. Images in the wrong format (PNG versus JPEG) can weigh down
a site. Images should account for 50–75% of the page weight. As a general rule, your
photographs should be saved as JPEG and your graphics (and screenshots) as PNG.
How to improve performance and conversions
Speed up with a trusted global infrastructure
Build your business on a CDN that automatically scales with you, with data centers
around the world. Be sure the CDN you select has servers in the regions you plan
to target in the future.
Optimize your marketing assets
Compress images to improve your load time and site speed score, and consider using
the srcset attribute on image HTML tags. This identifies a user’s device and switches
between different versions of the same image based on their browser. Identify what
percentage of your traffic is from high-DPI devices or retinal displays to determine
whether hi-res images are necessary. If you choose to reduce your image size by
using the WebP format, with a graceful fallback to a JPEG of the same size, note that
this will reduce the quality as well. There are ways you can optimize your site to create
room for high-quality images and media, considered a key part of ecommerce sites.
Replace GIF animations with video, and use the proper HTML5 semantic structure
for embedded videos.
Conclusion
Improving site performance requires difficult trade-offs. Design sacrifices that improve
speed can take away from the user experience. The reverse is true as well. What you can
do must be balanced with what you should do.
Let the data guide you:
Link site performance to financial performance.
Test the impact a 1-second change in load time has on revenue.
The path to a fast website is a long game. Actionable steps you can take to get there
include conducting an audit annually and tracking performance monthly. PrivateAnalytix users can acheive a quick win by implementing the low-weight (<1KB) PrivateAnalytix tracking pixel across their web pages.
With Google Analytics being blocked on >50% of web browsers, PrivateAnalytix will provide you with more accurate analytics. According to our case study, the varience in the number of visitors between Google Analytics and PrivateAnalytix can be as high as 52%.
Besides the improved website loading speed, PrivateAnalytix reduces the energy consumption of your website. In fact, the impact of the PrivateAnalytix pixel is so negligible that you can run in alongside the Google Analytics pixel to see the difference in the tracking accuracy and the energy consumption.
Sign up for a 7-day PrivateAnalytix trial today or contact us if you have any questions.